
Probability: Almost Certainty
Illustration of Factuality of Probability in Two-Dice Experiment
Shageldi Gayleyyv
October 30, 2018
Abstract
This experiment tests reliability of probability theory by using 2 fair dice rolled together to find the common sum. The probability theory states that the outcome of a random event, rolling two dice, cannot be determined before it occurs, but, by calculation, the highly likely chances can be calculated. According to the calculations, seven will be the most common sum that will occur in this experiment. However, is it for certain?
Introduction
What will be the most common sum of two fair dice are rolled 100 times? To answer that question, first, we should understand what probability theory tells about randomness. It states that the outcome of any random event is uncertain, but calculations can give highly expected outcome. According to the theory, the highly expected value in my experiment will be seven. To test the accuracy of the theory, I did this experiment.
Methods and Materials
To do this experiment we need the following equipments:
- Two, 6 sided, fair dice
- A small tea cup
- A computer to write down the data and plot the graph.
Procedure
- Take a small tea cup and put the dice in the cup.
- Slowly steer the cup so any dice does not come out of it.
- Throw the dice on to the pane surface.
- Open an excel file on the computer to write down the data. In one column type the value which is gotten from first dice and in the second column type the value of the second. In the third column use the summation command to add the two values. (You can also write down the data to a paper so you can type it to an excel afterwards)
- Repeat the procedure 100 times.
Results
Figure 1: All probable values that can occur when rolling dice.
| (1,1) | (1,2) | (1,3) | (1,4) | (1,5) | (1,6) |
| (2,1) | (2,2) | (2,3) | (2,4) | (2,5) | (2,6) |
| (3,1) | (3,2) | (3,3) | (3,4) | (3,5) | (3,6) |
| (4,1) | (4,2) | (4,3) | (4,4) | (4,5) | (4,6) |
| (5,1) | (5,2) | (5,3) | (5,4) | (5,5) | (5,6) |
| (6,1) | (6,2) | (6,3) | (6,4) | (6,5) | (6,6) |
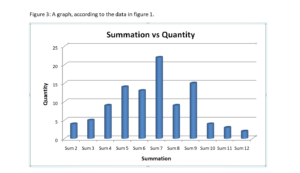
Figure 2: The quantity of the summation for each sum.
| Two-dice Summation | Sum 2 | Sum 3 | Sum 4 | Sum 5 | Sum 6 | Sum 7 | Sum 8 | Sum 9 | Sum 10 | Sum 11 | Sum 12 |
| Quantity | 4 | 5 | 9 | 14 | 13 | 22 | 9 | 15 | 4 | 3 | 2 |
Analysis
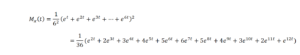
Figure 1 suggests that there are 36 total number of outcomes and getting summation 2, 3, 4, 5, 6, 7, 8, 9, 10, 11, and 12 have probability of , , , , , , , , , , and respectively. Therefore, getting 7 has greater probability than the rest. Ashok K. Singh, Rohan J. Dalpatadu, and Anthony F. Lucas are also proved in the research paper, The Probability Distribution of the Sum of Several Dice: Slot Applications, that 7 has biggest probability ratio. Their equation for two dice is:
Probability distribution of the sum of 2 fair dice
| X | 2 | 3 | 4 | 5 | 6 | 7 | 8 | 9 | 10 | 11 | 12 |
| f(x) |
As it is shown in the figure 2, the most common sum is seven as the probability theory predicted. However, according to the theory, the second common sum has to be 6 and 8 and the Summation vs Quantity graph has to be triangle. In the figure 3, we see that it is not a triangle and according to the figure 2, the second common sum is 9. Does this mean the probability theory sometimes fail? No, because, first, the theory states that the outcome of any random event is uncertain. Second, to get the exact result as it predicted, there must have infinitely many trails, but I did only 100 times which is nothing compared to infinite amount.
Conclusion
The purpose of the experiment was, to test whether the probability theory can predict the outcome. Although all the results were not as expected, theory predicted the most common value. The unexpected results do not prove that the theory might fail since it holds when there is infinite number of trials. Overall, the probability theory can predict the outcome for certain when all criteria are met.
Work Cited
Singh, Ashok K., Dalpatadu, Rohan J., Lucas, Anthony F. (2011). The probability distribution of the sum of several dice: Slot applications. UNLV Gaming Research & Review Journal, 15, Issue 2.
Appendix
| 1 st dice | 2nd dice | Sum | 1 | 5 | 6 | 3 | 3 | 6 | ||
| 1 | 6 | 7 | 1 | 5 | 6 | 2 | 5 | 7 | ||
| 5 | 3 | 8 | 1 | 4 | 5 | 6 | 4 | 10 | ||
| 1 | 6 | 7 | 4 | 3 | 7 | 4 | 5 | 9 | ||
| 5 | 4 | 9 | 2 | 4 | 6 | 4 | 5 | 9 | ||
| 2 | 1 | 3 | 1 | 1 | 2 | 2 | 1 | 3 | ||
| 2 | 6 | 8 | 3 | 1 | 4 | 6 | 5 | 11 | ||
| 1 | 1 | 2 | 4 | 3 | 7 | 2 | 3 | 5 | ||
| 4 | 5 | 9 | 6 | 1 | 7 | 4 | 4 | 8 | ||
| 3 | 5 | 8 | 2 | 2 | 4 | 4 | 3 | 7 | ||
| 6 | 3 | 9 | 5 | 2 | 7 | 1 | 6 | 7 | ||
| 4 | 2 | 6 | 4 | 3 | 7 | 1 | 3 | 4 | ||
| 4 | 3 | 7 | 3 | 1 | 4 | 5 | 1 | 6 | ||
| 1 | 4 | 5 | 4 | 5 | 9 | 4 | 6 | 10 | ||
| 6 | 4 | 10 | 1 | 2 | 3 | 5 | 4 | 9 | ||
| 4 | 5 | 9 | 2 | 3 | 5 | 3 | 4 | 7 | ||
| 3 | 2 | 5 | 4 | 2 | 6 | 4 | 1 | 5 | ||
| 3 | 2 | 5 | 5 | 2 | 7 | 3 | 1 | 4 | ||
| 5 | 5 | 10 | 1 | 1 | 2 | 3 | 1 | 4 | ||
| 4 | 3 | 7 | 1 | 4 | 5 | 4 | 2 | 6 | ||
| 6 | 1 | 7 | 4 | 1 | 5 | 4 | 3 | 7 | ||
| 6 | 6 | 12 | 4 | 5 | 9 | 2 | 3 | 5 | ||
| 3 | 6 | 9 | 2 | 2 | 4 | 3 | 2 | 5 | ||
| 1 | 5 | 6 | 2 | 5 | 7 | 2 | 2 | 4 | ||
| 6 | 2 | 8 | 3 | 5 | 8 | 3 | 6 | 9 | ||
| 6 | 2 | 8 | 5 | 4 | 9 | 3 | 5 | 8 | ||
| 1 | 2 | 3 | 5 | 1 | 6 | 1 | 1 | 2 | ||
| 3 | 6 | 9 | 1 | 5 | 6 | 6 | 3 | 9 | ||
| 3 | 2 | 5 | 2 | 5 | 7 | 2 | 6 | 8 | ||
| 3 | 4 | 7 | 3 | 1 | 4 | 6 | 6 | 12 | ||
| 6 | 1 | 7 | 6 | 5 | 11 | 1 | 5 | 6 | ||
| 1 | 4 | 5 | 2 | 1 | 3 | 3 | 3 | 6 | ||
| 5 | 6 | 11 | 3 | 4 | 7 | 5 | 2 | 7 | ||
| 3 | 6 | 9 | 4 | 1 | 5 |